MENUS
Platform Menus
← Swipe →

Professional technical analysis tool with 18 advanced modules, algorithmic confluences, and real-time macro analysis. Make informed investment decisions.
Professional tools designed to maximize your analysis and improve your investment decisions
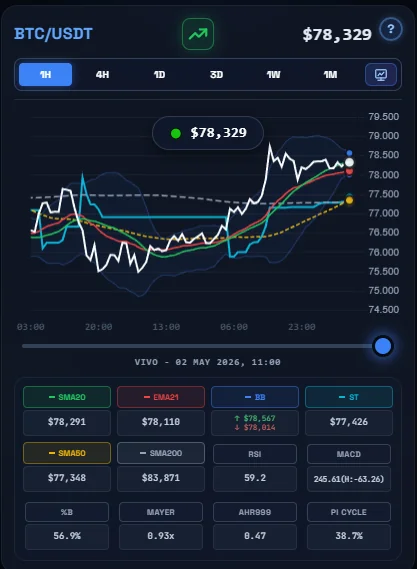
Advanced technical indicators: ATR, Bollinger Bands, CMF, MACD, RSI, Supertrend, and 12 more modules for a complete market analysis.
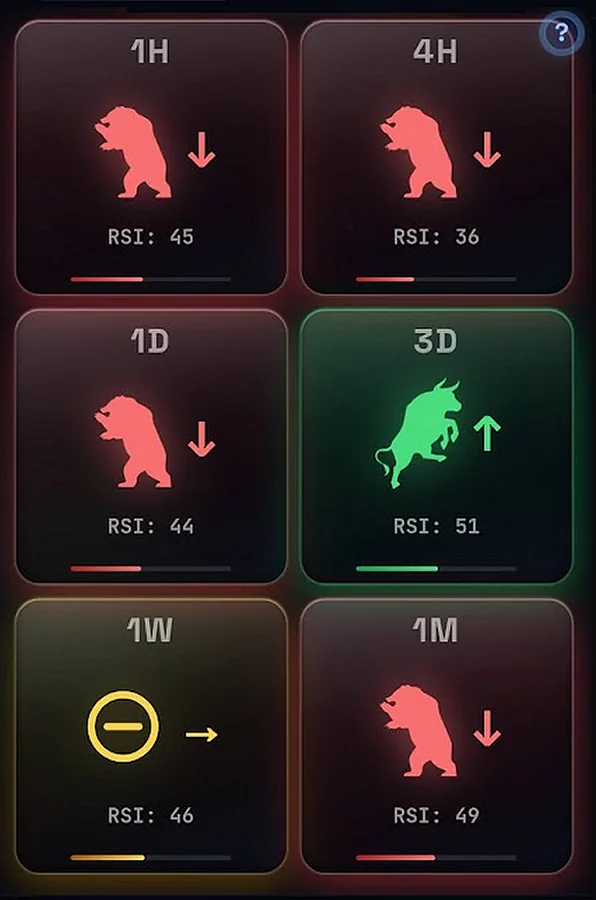
Algorithmic system that combines 6 different timeframes (1h, 4h, 1D, 3D, 1W, 1M) to identify high-probability signals.
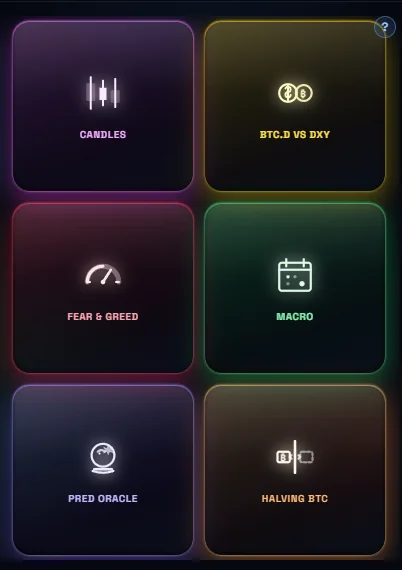
Tracking of DXY, Bitcoin dominance, economic calendar with key events (NFP, CPI, FOMC), and their impact on cryptocurrencies.
Advanced visualization with Chart.js for analyzing trends, correlations, and historical patterns across all indicators.
Direct connection with Binance, CoinGecko APIs, and official sources for information updated every second.
Optimized for smartphones with an intuitive interface, touch gestures, and a fluid experience on any device.
Each module is designed for a specific aspect of technical analysis
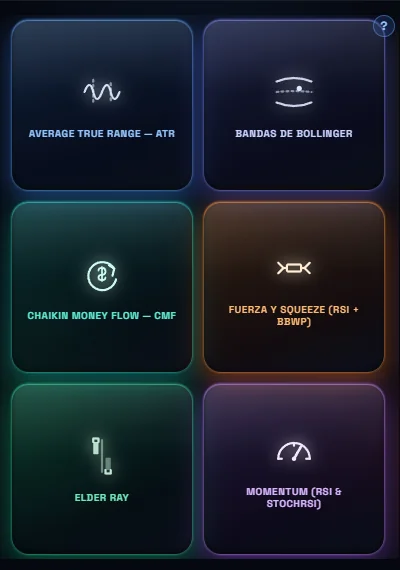
Volatility and average true range to identify high/low activity zones.
Price position within the bands to detect oversold and overbought conditions.
Institutional money flow and buying/selling pressure in the market.
Momentum and squeeze to identify compressions before explosive movements.
Bulls vs Bears power with Bull/Bear Power to confirm trends.
Stochastic RSI for precise entry and exit timing in extreme zones.
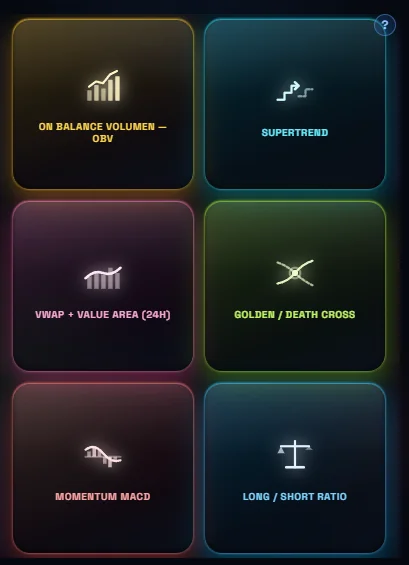
Volume analysis and On-Balance Volume to confirm price movements.
Dynamic trend indicator with clear buy/sell signals.
Tracking of BTC.D to identify rotations between BTC and altcoins.
MA50/MA200 system to detect golden/death crosses and trend changes.
Convergence/divergence with histogram for momentum and reversals.
Ratio of long vs short positions for futures market sentiment.
Historical indicator of market tops based on 111/350 day moving averages.
Correlation between the dollar and Bitcoin dominance for macro analysis.
Market fear and greed index to detect emotional extremes.
Key economic events: NFP, CPI, FOMC, BTC options expirations.
Analysis of halving cycles and altseasons for strategic timing.
23.6 / 38.2 / 50 / 61.8 / 78.6 levels drawn over the automatically detected impulse.
Free guides to the indicators the app calculates: what they measure, how to read them and which mistakes to avoid.
Overbought, oversold and divergences: how to read the RSI without the usual mistakes.
Crossovers, zero line and histogram: the fine reading that front-runs classic signals.
%B, Bandwidth and the volatility squeeze that precedes the big moves.
ATR-based dynamic support: signals, trailing stops and limits in sideways markets.
The capital rotation map and how it signals altseason.
The indicator that called the 2013, 2017 and 2021 tops — and where it fails.
The four halvings, the four-year pattern and the metrics framing this cycle.
The market's emotional thermometer and how to read it as a contrarian signal.
Who leads between Bitcoin and Ethereum and why it front-runs capital rotation.
How the monthly XRP release works and why it is not a halving.
What each measures, why they do not compete and which to use in each market.
What it measures, why it has spikes of its own and how it differs from BTC.D.
Why the general index is not enough and how to build an ETH-specific read.
What the coloured bands are, why the regression is recalculated and what it is worth.
Where 61.8 and 78.6 come from, why 50% is not Fibonacci and how they are drawn.
Why it measures size and not direction, and how to use it for stops.
An indicator computed on the RSI: why it saturates so much.
It counts accounts, not money: why that inverts the reading.
Two indices that get confused and share not one component.
The OBV adds the whole volume by the sign of the close.
The RSI measures travel and the BBWP volatility: read together.
Weights volume by where the candle closes, not by the sign.
The golden cross arrives once the move has run for months.
Two forces measured against the 13 average, not against zero.
Not where price goes: at what hour it will move.
